Let's get nerdy
What makes energy management with Alligator so powerful...
The Energy Manager
...and why he or she needs Alligator
Energy managers often have dual roles, are sometimes ill, take part in meetings or go on holiday. Whatever the case, it is impossible to keep an eye on energy flows around the clock. But Alligator does this and always has two objectives: To identify the best case and to highlight or alert deviations from it.
This is precisely what creates the space for the actual task: managing energy - Alligator provides the key figures for this.
We are efficient
We are Alligator
With Alligator, we take energy efficiency to a new level. Our energy management software is not just a tool for visualising and analysing your consumption data in real time; it is an intelligent partner that does the work for you. Thanks to its intuitive operation, Alligator is easily accessible and supports you effectively in process optimisation. It offers customised solutions tailored specifically to your needs, whether through unlimited expandability, compatibility with all common measuring devices and database formats or by providing unlimited, individually configurable dashboards and user access. Alligator is designed to integrate seamlessly with your existing systems while offering the flexibility to grow with the changing needs of your organisation.
Through the combination of real-time measurement, intelligent consumption analysis, extensive reporting, a comprehensive alarm system, a detailed key performance indicator system and much more, Alligator makes a significant contribution to preventing energy waste, increasing your energy efficiency and uncovering potential savings. Our energy management software is customisable and can even be white-labelled to ensure complete brand consistency. Discover how Alligator simplifies and optimises your energy management for a more sustainable future and significant cost savings. Alligator is eligible for funding and supports you with your DIN EN ISO 50001 certification.
Discover Alligator: energy management that thinks for itself...
Some functional details
Make an appointment for an individual presentation
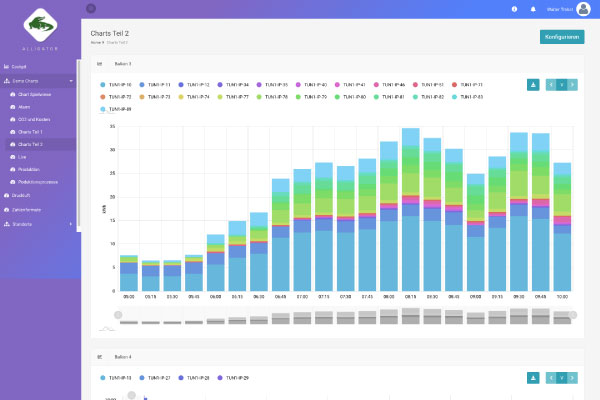
Diverse range of charts
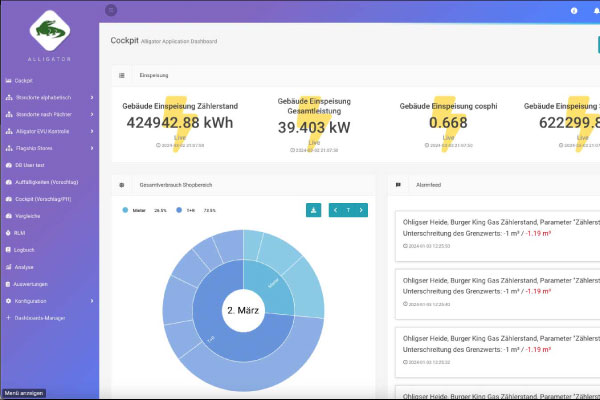
Alligator provides a comprehensive range of visualisation options, including line charts, bar charts, Sankey charts, sunburst charts and many more, supplemented by table views, heat maps, RLM and analysis charts. This variety allows you to view your energy consumption data from different angles and carry out in-depth analyses.
For added flexibility, you can export these visualisations via quick export, e.g. as an image, CSV or PDF, to share your findings or document them in detail. With the option to customise data intervals from live data to annual overviews, Alligator offers the ability to effectively monitor and analyse both immediate changes and long-term developments in energy consumption.
Dashboards-Manager
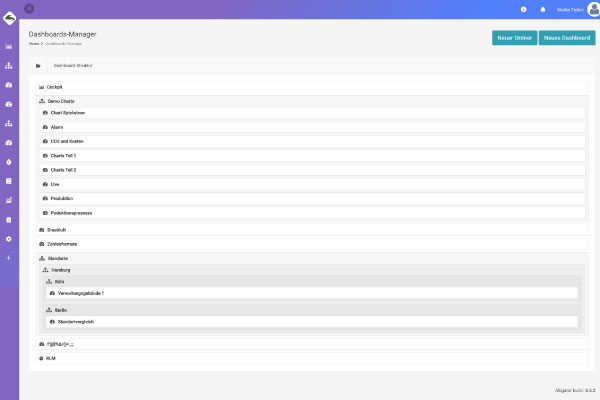
The Dashboard Manager in Alligator offers users a flexible and intuitive platform for customised dashboard design. You have the freedom to create as many dashboards as you need to monitor and analyse different aspects of your energy consumption. Not only can these dashboards be personalised, but they can also be easily shared with colleagues, encouraging collaboration and communication within your team.
In addition, Alligator allows the dashboards to be assigned to users according to their area of responsibility. This ensures that every user can access the information relevant to them quickly and efficiently. The dashboards themselves are flexible; they can be moved within the system as required to achieve an optimal arrangement.
Alarm system
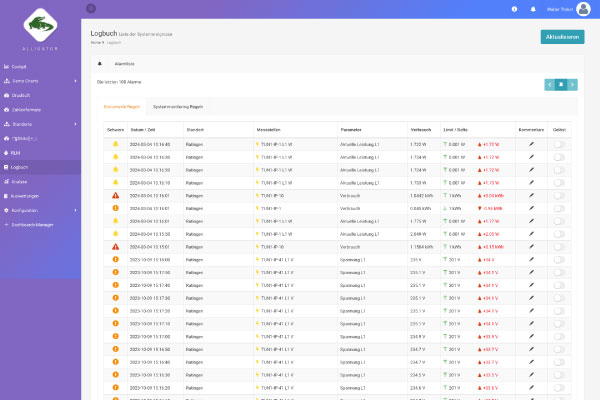
Alligator's alarm system provides comprehensive monitoring of your energy consumption data with the ability to set thresholds for all data points. This functionality enables effective prioritisation of alarms so that you can react quickly to critical changes. You can also define different recipients for the alarm messages to ensure that the right team members are informed immediately.
For a quick overview of current alarm messages, an alarm feed can be integrated directly into your dashboards as a widget. For in-depth analyses and tracking, the logbook offers a detailed view of each alarm. Here you can comment on alarms, update the status and plan preventative measures by recognising recurring alarm patterns.
RLM/load profile
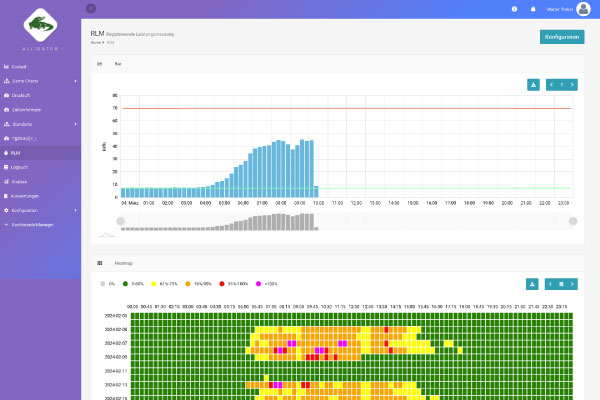
Load profile management, including monitoring of the quarter-hour maximum, is a core aspect of Alligator and receives special attention. The energy management software not only integrates the comprehensive recording and visualisation of this data as a basic function, but also adds an additional dimension of customisation through the Dashboard Manager. Users can add specific widgets for the load profiles of individual machines or entire production processes to enable an even more precise analysis of their energy consumption patterns.
In addition, Alligator offers a heat map that provides a detailed view of all quarter-hourly values over a period of 30 days. This coloured visualisation shows at a glance at which times consumption reaches which percentage of maximum consumption. This simple form of presentation makes it possible to quickly identify consumption peaks and provides valuable insights to further optimise energy efficiency and load management.
Reports
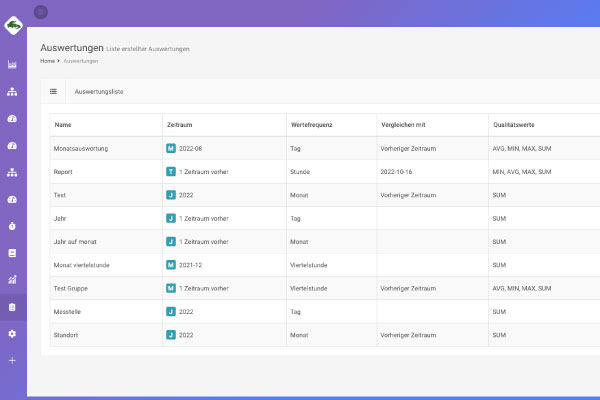
Alligator offers a comprehensive reporting system that enables the creation of reports across all recorded measurement values. In addition to a range of standard reports that cover common requirements, the energy management software also offers the flexibility to create customised reports according to individual needs. Whether for internal audits, specific departments, internal or external stakeholders: Alligator adapts to provide customised reports that deliver precise insights and analyses.
As a rule, we set up the reporting system for you for commissioning and modify it according to your requirements. Your users can also create or change their own reports using the integrated editor.
Alligator is also a popular tool for "fuelling" areas of the company that are only partially involved in energy management, such as the ESG team or purchasing.
EnPI
Alligator places particular emphasis on energy performance indicators (EnPIs), which serve as the foundation of effective energy management. Our energy management software is characterised by its ability to generate, create and analyse an unlimited number of EnPIs, including the integration of static and flexible data that cannot be measured directly. In addition to the usual consumption data, key figures such as production area, turnover or production figures can also be created and correlated with the consumption data.
This comprehensive analysis capability enables a detailed site comparison and offers the possibility of calculating energy performance indicators down to specific articles or product groups. This in-depth insight is particularly beneficial for defining energy management targets and precisely documenting their achievement.
Analysis-Tool
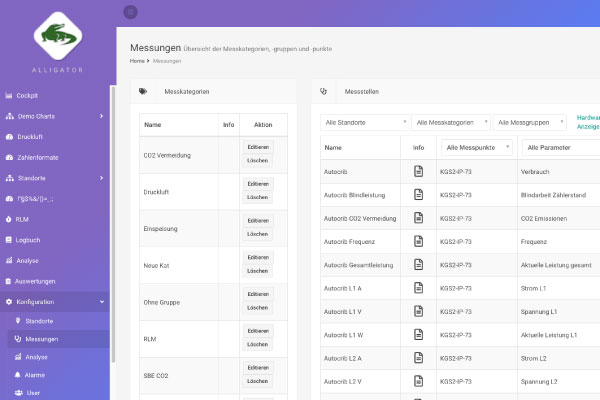
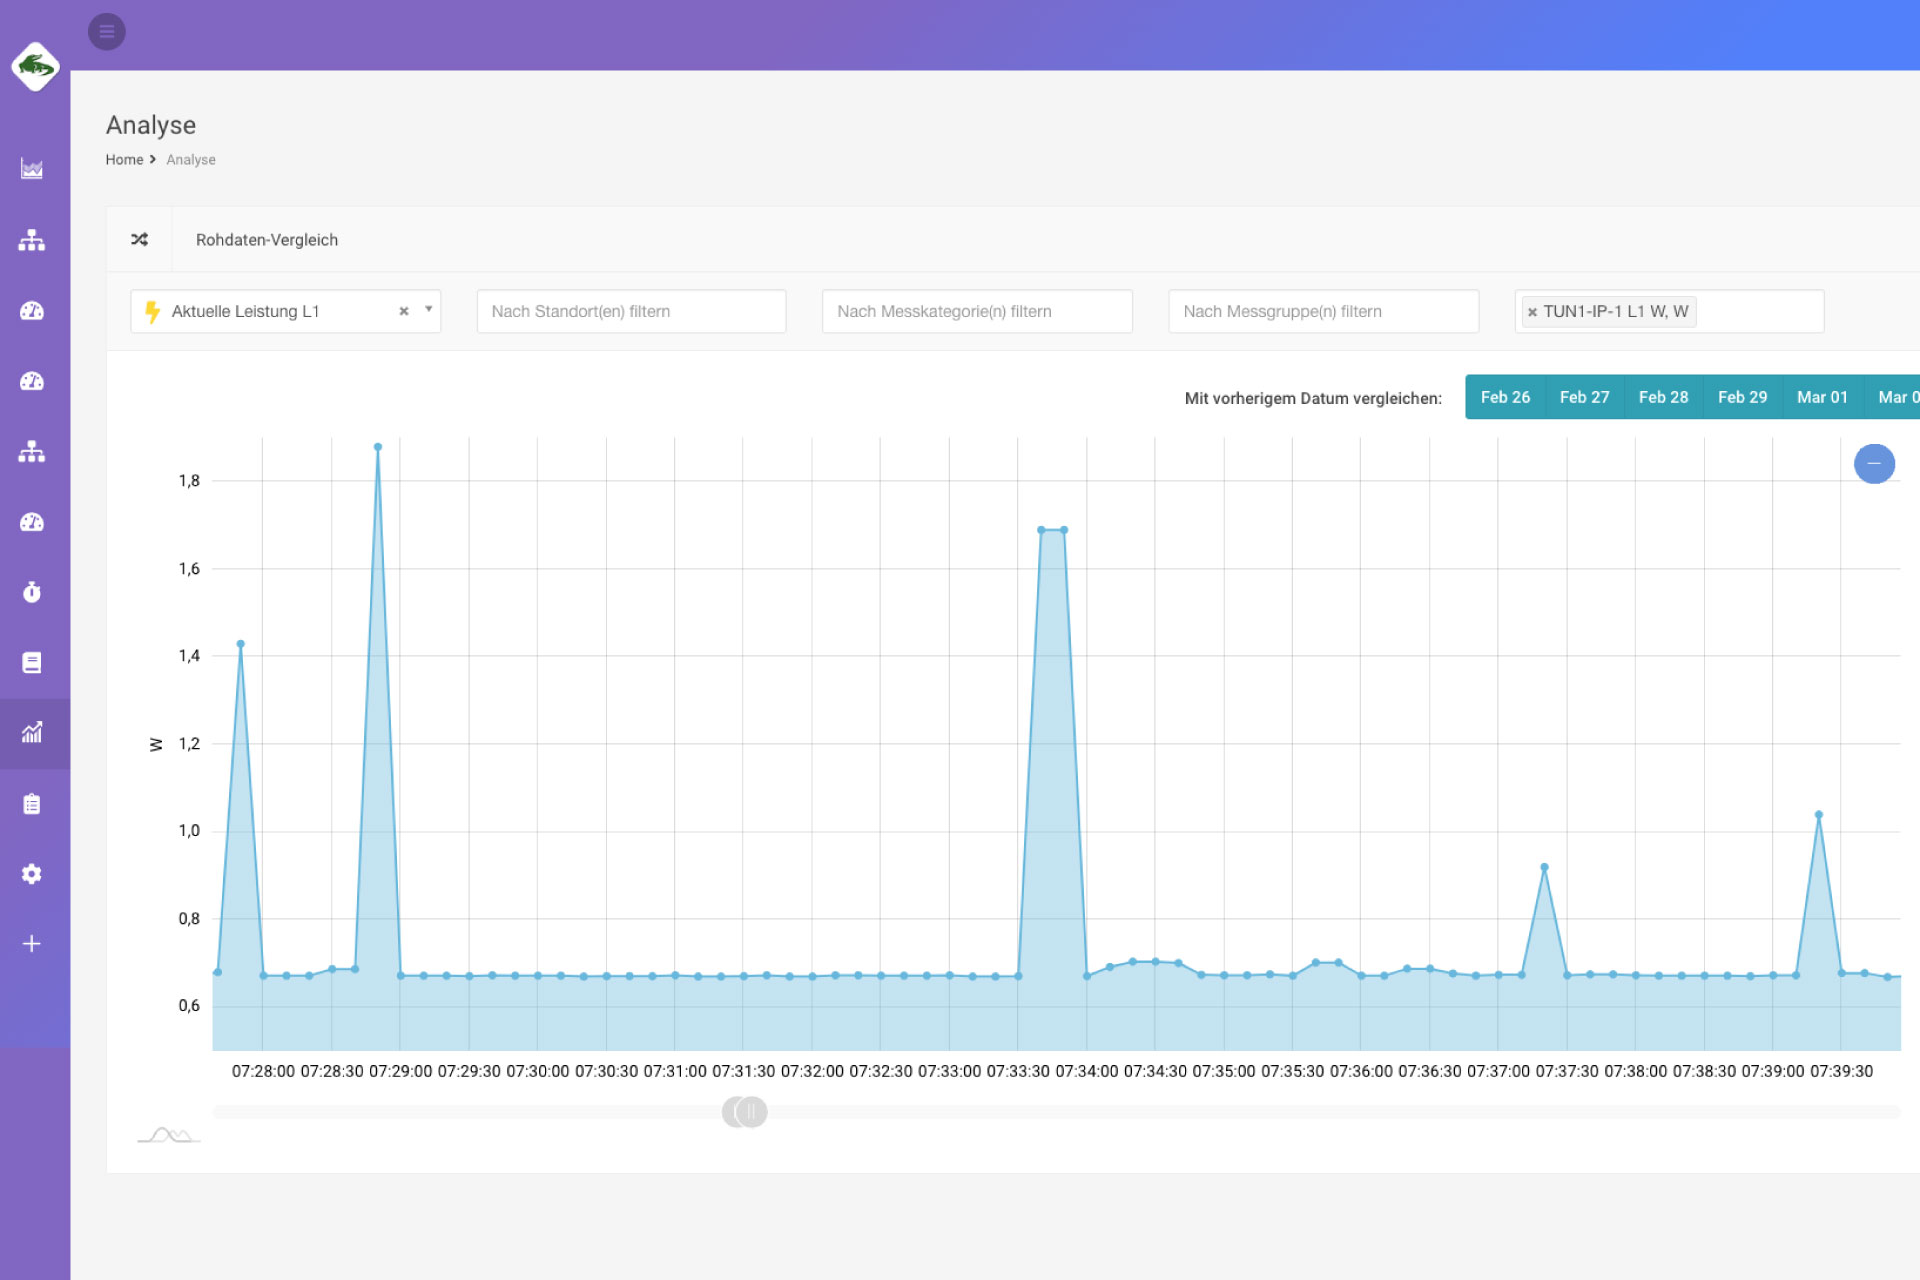
Alligator's analysis tool is specially designed to cope with the flood of data transmitted by numerous sensors in a matter of seconds. This not only involves analysing billing-relevant data such as kWh consumption, but also the quality of systems and processes. Alligator measures, visualises and analyses a wide range of values that provide information about the quality of systems and processes, such as cosine phi, volts, watts, amperes, pressures, temperatures, flow rates and much more. Our system can visualise hundreds of different types of data - and if something is not yet in our portfolio, we will add it.
Within the analysis tool, this data can be analysed precisely and retrospectively down to the second. This enables the identification of outliers, peak values and low performers. In addition, relevant events can be alerted immediately to enable quick and well-founded decisions and continuously improve the efficiency and reliability of systems and processes.
Interactive Map
For an intuitive visualisation of the location, Alligator offers the option of creating individual interactive maps based on hall plans or similar bases. These maps clearly display all measuring points and provide visual feedback on current energy consumption. If a measuring point triggers an alarm, it is highlighted in red on the map for quick identification and reaction. Alligator enables the creation of any number of layers within these interactive maps. Users can zoom into specific production areas to see each individual energy consumer in detail. This customised representation enables users to orientate themselves in their familiar working environment and to identify and analyse energy consumption and potential savings directly in the context of their own location.
Conclusion: Alligator is secure, compatible and future-proof
Our energy management software was designed and developed in Germany. We therefore attach great importance to the fulfilment of all data security requirements in accordance with ISO 27001. Your sensitive measurement data is stored exclusively on German servers or - on request - only on your premises.
Have you already installed energy management software and want to change? Hardware is already in use and a number of data records have already been created? No problem! With our Alligator software, it is possible to integrate existing infrastructure.
As an innovative software provider, we attach great importance to always being state of the art. Whether new trends in software design or new technologies in terms of data infrastructure and security. Alligator is adaptable and capable of development.
Here are some examples for you. Please make an appointment with us. We will be happy to show you more.
Alligator Cloud Data Centre (ACDC): Our Big Data data centre
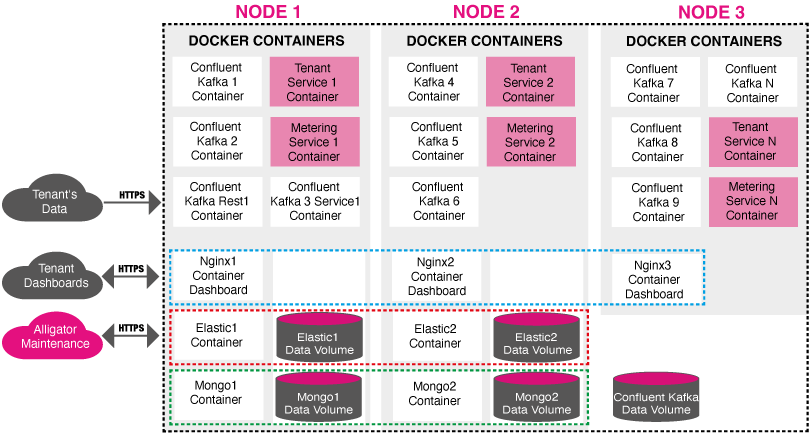
With our ACDC, we rely on a big data-capable data infrastructure that meets today's requirements for data processing and scalability. By using container applications and stream processing, we are able to process and display large volumes of data in real time.
Alligator uses the flexibility and efficiency of containers to create a modular and easily customizable environment. This means that containerization allows for easy scaling so that our infrastructure can keep up with the growth of your system or the increasing amount of data.
Stream processing allows Alligator to process large data streams in real time, enabling instant analysis and visualization of energy data. The ability to analyze data on-the-fly is crucial for effective energy management to prevent energy waste in time.
The type of use and security are comparable to online banking or a search engine.
Sensors and data sources,
that we process in this way...
Let's talk...
Your message has been sent.

